Aug 24, 2008
One Hot Topic
By John Takeuchi, Meteorologist Interview in the Vacaville, CA Reporter
Q. Is the atmosphere warming?
A. In some places, yes; in other places, no.
Q. Is warming unusual?
A. No, the atmosphere has periodic warming and cooling cycles.
Q. Does CO2 cause global temperatures to rise?
A. Carbon dioxide (CO2) is a minor component of the atmosphere - historically between 0.022 percent and 0.038 percent - and its contribution to heat retention is likely minor when compared to that of water vapor, which is the dominant “greenhouse gas.” Global warming proponents claim that human activity is increasing CO2 in the atmosphere - that’s true - and that the increased CO2 is causing air temperature to rise. Studies, however, point elsewhere. When long-term plots of global temperature and CO2 content are overlaid, CO2 lags temperature. There must be another culprit. Oceans are the main repository for CO2. They release CO2 as their temperature rises - just like your beer. This strongly suggests that warming oceans - heated by the sun - are a major contributor to CO2 in the atmosphere.
Q. Why all the fuss about global warming?
A. Note that environmentalists and politicians are leading the charge. Environmentalists are trying to stop growth by predicting catastrophe as the atmosphere warms - people starving; species dying as habitat disappears; cities inundated by rising sea levels - without any evidence that these outcomes are even feasible. Lately, politicians have come to see global warming as a way to raise revenue by rationing CO2 production with schemes such as the “cap and trade” legislation now in Congress. The taxes assessed for producing CO2 could be huge. But global warming as proclaimed by Al Gore and Co., is a hoax. Much is made of the “consensus” in the United Nations committee dealing with global warming. It should be noted that very few of its members are meteorologists. It should also be remembered that science is based on facts, not consensus. The facts do not point to the dire consequences promoted so loudly by Mr. Gore and the media. The global warming story is full of half-truths, outright falsehoods and speculation. That Mr. Gore received a Nobel Prize and an Academy Award shows the politics of those organizations, not any scientific acumen.
Q. So what?
A. Ignored by global warming promoters is the human cost of their remedies. Reducing CO2 to below 1980 levels means shutting down economies dependent on hydrocarbon-based energy: natural gas, petroleum, coal. Visualize the dreary world in a Charles Dickens’ tale. That’s what America would look like. Solar, wind and hydro cannot fill the gap - yet. Until we improve such technologies, we must go after the oil offshore and in Alaska. And we must go nuclear. Starting now. Read more of this interview here
Aug 24, 2008
Who Rules the Climate?
By Dr. Arnd Bernaerts, Oceanclimate
Water rules nature!: Not nature rules climate, but water rules the nature on this earth. Water is the essence of anything that makes the earth special, as a brief comparison with the moon quickly shows. Earth’s water volume is to 97% contained by the oceans, which have an average temperature of just ca. 4 degrees. Only their huge storage of heat and water supply to the atmosphere make climate, although variable, and life on earth possible. Climate would not exist, and could not work without water.
Even after having existed for many decades, the science of weather and climate did not attach the importance to the oceans which they deserved. In 1939 at the latest, it should have become apparent to experts that climate is a function of water. Leonardo da Vinci (1452 - 1519) put it succinctly long ago: “Water is the driver of nature.” Since the oceans exceed the total amount of atmospheric moisture by a factor of 1000, there is ample justification for defining climate as the “continuation of the seas by other means,” because they feed gigantic quantities of heat and water into the atmosphere (see above). If climate had been understood in this sense at the time, it would have been possible to mitigate the rising political turbulences in 1939 at least to some degree by warning about the climate changes which would occur. But the science of meteorology did not understand much at that time and said nothing.
For more than 20 years now, scientists have believed they are called upon to predict apocalyptic scenarios of climate change and to demand costly programmes and taxes from politicians. They do so without any consideration of events which their fathers and grandfathers experienced themselves. Those generations marched off to a world war in 1939, and only four months later there was a collapse of the climate. The temperatures in Northern Europe fell to a level which was extreme even for the small ice age. Such low temperatures had not been experienced in more than 100 years. The temperatures were 5 - 10 degrees below the average of many years. Although this was not even 69 years ago, the extreme winter of 1939/40 remains un-investigated.
The two following winters, 1940/41 and 1941/42, set a large number of records for cold in Northern Europe as well as marking the start of a noticeable cooling of the northern hemisphere lasting more than three decades. In 1948, the German meteorologist M. Rodewald described it in this way: “(It is shown) a “secular heat wave” made itself felt over most of the Earth. We noticed this especially in the increasing mildness of the winters which, while beginning in the previous century, became more and more striking between 1900 and 1939. So it is all the more surprising that there was a series of three severe winters in succession in 1939/40, 1940/41 and 1941/42, appearing to indicate a sudden reversal of the previous development rather than a slow deceleration, contrary to the sustainment tendency of circulation and temperature deviation.” Anyone who claims to understand climate change must also be able to explain these events. Anyone who can explain these events will recognise that the oceans play the key role in any and all questions of the climate.
Climate is the continuation of the oceans by other means: The overriding effect of the oceans rectify this definition for CLIMATE. It would bring the focus to the backbone of the climate system. At least the general public would understand for what the term CLIMATE stand for. Once adopted it would presumably lead quickly to the understanding of the two major climatic shifts during the last Century, namely the early arctic warming that started in winter 1918/19, and the global cooling that started in winter 1939/40 lasting for three decades. Intro above from Ocean Climate. In the following paper on that site, the sudden cooling at the end of the warmest decade of the 20th century is described.
Europe suddenly experienced its coldest winter in more than 100 years. Since the 19th century, winters had become successively milder. “The present century has been marked by such a widespread tendency towards mild winters that the ‘old-fashioned winters’, (sound familiar?) of which one had heard so much, seemed to have gone for ever. The sudden arrival at the end of 1939 of what was to be the beginning of a series of cold winters was therefore all the more surprising,” reported the British scientist A. J. Drummond in the QJoR Met. Society as early as 1943. But neither he nor climate researchers in general went searching for the cause. This article explores the possible reasons.
See also this story in which Arnd shows how the oceans are shown to play a role in the arctic cyclical warming and cooling.
Aug 24, 2008
No Trend in Drought or Floods
Climate Skeptic
It is often said by warming alarmists that a) global warming will increase both extremes of droughts and floods and b) that we already see these conditions accelerating (ie with California droughts and this year’s midwestern floods). The recent NOAA/NASA draft CCSP climate change report I commented on last week said
“Temperature and precipitation have increased over recent decades, along with some extreme weather events such as heat waves and heavy downpours.
Widespread increases in heavy precipitation events have occurred, even in places where total amounts have decreased. These changes are associated with the fact that warmer air holds more water vapor evaporating from the world’s oceans and land surface. Increases in drought are not uniform, and some regions have seen increases in the occurrences of both droughts and floods”
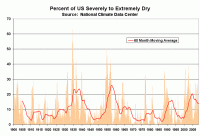
The Antiplanner, in an article on firefighting, shares this data at the National Climate Data Center that I had never seen before. It is the monthly estimate of the percent of US land area subject to extremes of wet or dry weather. First, the dry weather:

See larger image here
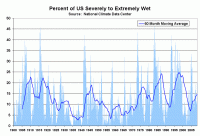
And then the wet weather:

See larger image here
There is no trend here, and certainly no acceleration of a trend, merely what is obviously a cyclical phenomenon.
I am constantly amazed at the ability of alarmists to dedice the second derivitive of natural phenomenon (eg an acceleration in a rate of change) from single data points (e.g. 2008 flooding in the Midwest). Read more here.
Aug 23, 2008
Australian Space Weather Agency Revises Solar Cycle 24 Start, Adding 6 Months
By Anthony Watts, Watts Up With That
Solar Cycle 24 just can’t seem to get rolling. IPS announced today (IPS is the Australian Space Weather Agency), that it has changed its forecast for Solar Cycle 24, pushing it’s start into the future by six months. They write:
Due to the proximity of the IPS predicted rise of solar cycle 24 to observed solar cycle 23 solar minimum values, and the apparent lack of new Cycle 24 sunspots, IPS has again moved the predicted solar cycle away by 6 months.
The announcement came on the IPS web page, today, on the day that two small cycle 23 sunspots have started to appear near the solar equator. Many had expected more cycle 24 spots to be visible by now, but the sun remains quiet, and has been producing more cycle 23 spots than cycle 24 spots so far since the first cycle 24 spot was seen on January 4th, 2008.
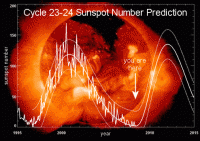
NASA’s David Hathaway is still expecting a start of cycle 24 this year, with an upturn soon, late in 2008 or early 2009. As many of you know, the sun has been very quiet, especially in the last month. In a July 11th 2008 NASA news release article titled What’s Wrong with the Sun? (Nothing) solar physicist David Hathaway goes on record as saying: “It does seem like it’s taking a long time,” allows Hathaway, “but I think we’re just forgetting how long a solar minimum can last.”

See larger image of the steepening Hathaway curve here
The new IPS prediction puts the sunspot upturn to begin around April to July 2009. It will be interesting to see if Hathaway follows with a new prediction in the wake of the IPS announcement. There already has been one change in Hathaway’s prediction this year, so it would not be surprising to see another.
Icecap Note: NOAA SWPC and most other sites (one exception was Catania Friday though gone today) did not count the small apparent spots this month and are still registering a “0” for monthly sunspot number with 33 straight days of no sunspots (see daily and monthly counts here and here). The final monthly International Sunpot number will come from Belgium based on observations from the various global solar sunspot monitoring centers.
Aug 21, 2008
India’s Future Climate: No Cause for Alarm
By Dr. Madhav Khandekar
India as a whole is dominated by the monsoonal climate where the summer rainfall (called the southwest monsoon, June-September) is the most important climate event. Traditionally, India has been an agricultural country where timely arrival of summer rainfall becomes critical for the monsoon crops (known as Kharif), most important of which is rice, grown primarily in the Peninsular India. The four summer months provide an average of about 85 cm ( ~40 inches) of rainfall over most of India. (this is one of largest amount of seasonal rainfall anywhere in the world over a large area like India). Outside of summer monsoon, India does experience winter rains via the northeast monsoon season (December-February) which provides rains (albeit much smaller amount) to the southeast Peninsular region of India and parts of Sri Lanka. In the northwest parts of India, some winter rains are produced (~5 cm) in the wake of western disturbances which are part of mid-latitude weather systems making their way into northwest India through the western Himalayan passes. The southwest monsoon season is the most important rainy season for India’s agriculture and also for re-charging of water levels in a large number of reservoirs in and around big cities in the Peninsular India like Mumbai, Pune, Hyderabad and Bangalore. This is also the season for many rivers to be recharged and distribute their water to a large number of villages and towns.
The Indian Monsoon together with the south Asian monsoon is the largest seasonal abnormality in the global climate system and impacts about 60 percent of world humanity at present. In broader (simpler) terms, the Indian monsoon is often described as a large-scale sea-breeze circulation in response to ‘hot’ land surface and ‘cool’ oceans (Arabian Sea in the west and Bay of Bengal in the east) during the pre-monsoon months. In reality the Indian Monsoon is one of the most complex features of the earth’s climate which cannot be adequately simulated by climate models at present (Shukla 2007). In the last 25 years, hundreds of studies have been published on Indian/Asian monsoon and it is now widely accepted that the Indian monsoon onset and intensity are controlled by large-scale features of the atmosphere like the ENSO (El Nino-Southern Oscillation) cycle in the equatorial Pacific, the Eurasian snow cover during the preceding winter and the equatorial stratospheric Quasi-Biennial wind Oscillation, known in scientific literature as the QBO.
Will the Indian monsoon be adversely affected by climate change in future? Recent studies do not suggest any adverse impact at this point in time. The Indian monsoon has always exhibited significant departures from normal from time to time as can be seen in Figure 2 which shows seven major droughts and six major floods in the 150-year instrumental record. These droughts and floods are part of natural climate variability and do not show any linkage to climate change, human-induced or otherwise. The IPCC 2007 climate change documents project a mean temperature increase of about 10C for India in the next thirty years, while projecting less than 5 percent increase in monsoon precipitation. Several recent studies have identified a number of uncertainties in these projections and the future warming of the earth’s surface is now projected to be only about 10C to 1.50C over the next 100 years. In any case, the revised projections suggest only marginal changes in India’s climate over the next thirty years or more. The possibility of catastrophic future climate change impacts for India (ex. escalated sea-level rise on east or west coast) appears to be small at this time. Read more here.
|


